There are many IT companies, but few really stand out. SolarWinds is one of such companies. They started off with one product, but because they developed a quality product, with unique features and affordable pricing the company started to grow.
Now they have a complete portfolio of products dedicated to IT Professionals. SolarWinds flagship product, Network Performance Monitor is a robust monitoring solution with unparalleled visibility to your network. Further, SolarWinds NPM can tap in to your network devices and servers to monitor, analyze and prevent problems before they happen. Currently, SolarWinds also provides free tools for IT Professionals.
SolarWinds Network Performance Monitor 11 Review
Installation
Minimum requirements for installation are as follows:
Hardware: Dual CPU, 3GHz; 3GB Memory, HDD 20GB
Operating Software: Windows server 2003 or Windows server 2008 (32bit or 64bit) including R2 with IIS installed, .NET framework 3.5SP1 is recommended, SQL Server 2005 SP1/2008 (Express, Standard or Enterprise)
Installation is really simple. First, you click on Setup.exe, click on next a couple of times, wait a little bit and then the program is installed. Unlike other network monitoring solutions, SolarWinds NPM uses a web interface. Once installed, the first step is to add devices so the user can monitor them.
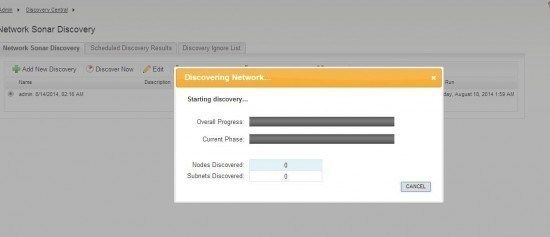
NPM’s Network Sonar will scan the network and present devices you can choose from to either import all or select specific devices like Routers and Switches.
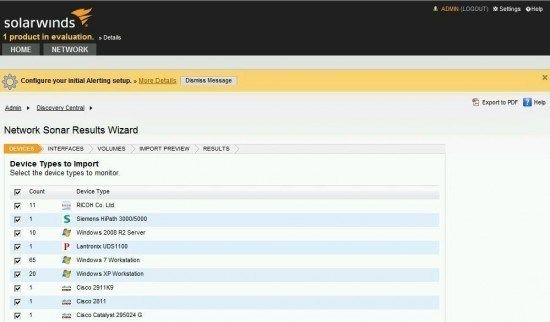
You can choose which interfaces you want monitored.
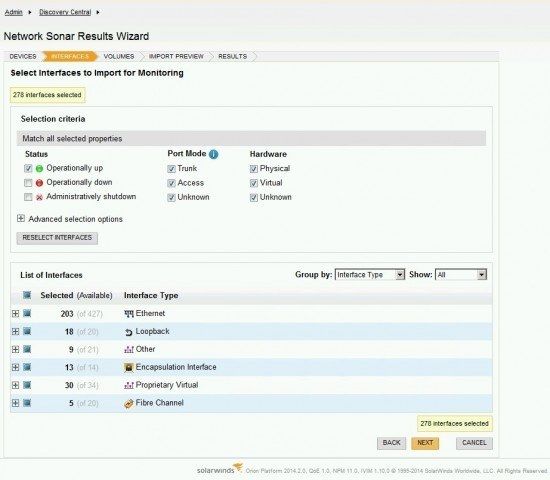
Devices are visible on a nice looking dashboard where you can see what is happening in your environment. Network Sonar can automatically monitor your network and import devices when they are connected on the network automatically.
SolarWinds NPM ships with MIB support for the majority of most common devices. If your device is not supported you can create your own custom poller to monitor UPS or a device which is not on a supported list.
SolarWinds Network Performance Monitor 11
After devices are imported, you are presented with a nice looking dashboard. You will immediately see which devices are problematic. On the left side, Nodes are grouped by Vendor. You can expand a vendor and select the device you are looking for. Below Nodes is an area dedicated to triggered alarms. On the right side there is a map where you can customize and add your devices. Below the map, there is an area dedicated to the new features introduced in NPM11 called Quality of Experience.
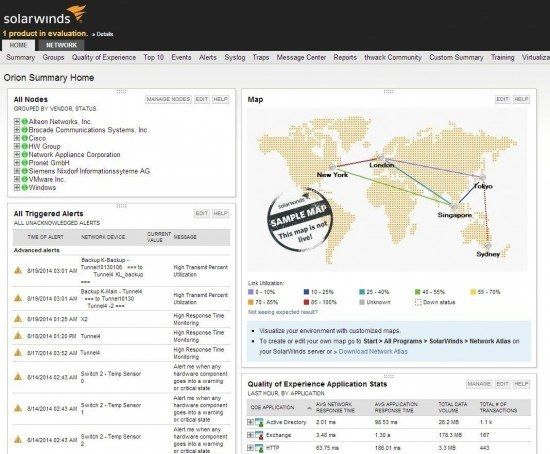
I really like the way NPM11 can monitor the entire infrastructure. You can pinpoint why service is slow. I don’t know how many times I have heard that we have to buy a new server because the program is running slow. But it’s not always the servers fault. It can be congestion in the network or a problem with configuration. With NPM 11, you can monitor network infrastructure, virtual infrastructure and physical infrastructure.
You are able to see routing tables, changes in default routes, BGP transitions and flapping routes. You also get visual network route topology.
Combine that with Virtual infrastructure monitoring where you can monitor vCenter to hosts and drill down to VMs and you have a complete solution for monitoring.
If you have multicast devices you will love NPM. In real-time you can see multicast information for your devices. In case you have a problem you can easily see which device is causing you headaches. You can group devices and you can look at historic data.
What about hardware? You can monitor key sensors like temperature, fan speed, power supply, and create alerts.
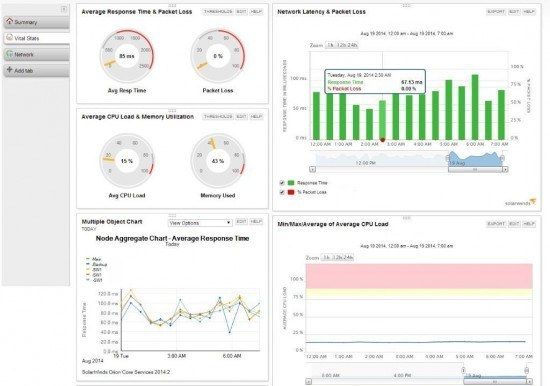
I really like the usability of SolarWinds NPM11, It’s really easy to navigate and the information that’s needed is provided without any unnecessary complicated steps. When you open the device you are interested in, you will see tabs on the left side. All the information you need is within reach.
Information about response time, CPU load time, Memory, Packet & Loss time is so neatly presented that even a CEO can understand it. Now imagine two scenarios. First one, before NPM: You see your CEO, you tell him that you have to replace IT Equipment because it’s running slow. First response you will likely receive is, “No! We don’t have money, we can hold on for another year.” The other scenario is when you have NPM: “Hi, we have to replace equipment, it’s running slow, please look at the following graphical information. You can see that we are not running at peak performance, and our network devices are having faults.” You will most likely receive the following response, “OK, Let’s do it”
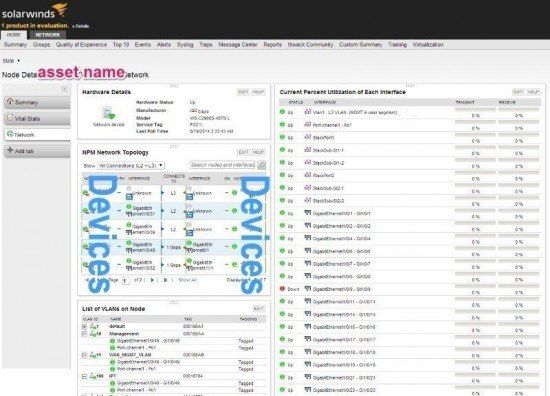
Within in the Network tab, when you can look at network information from the device and view network topology. On the left side, you have ports from the device you’re monitoring. On the right side you can view these ports and their corresponding devices. You also see current utilization of ports.
Deep packet inspection
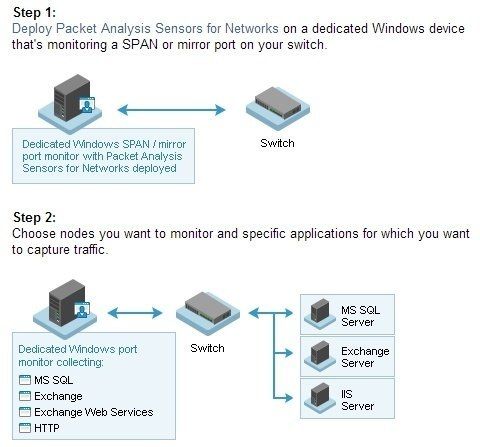
One of the new features in NPM 11 is called Deep Packet Inspection. DPI is available for both, network devices and servers. With DPI for network devices, you have to install DPI sensors to the dedicated Windows based device that is monitoring SPAN or mirror port on your switch.
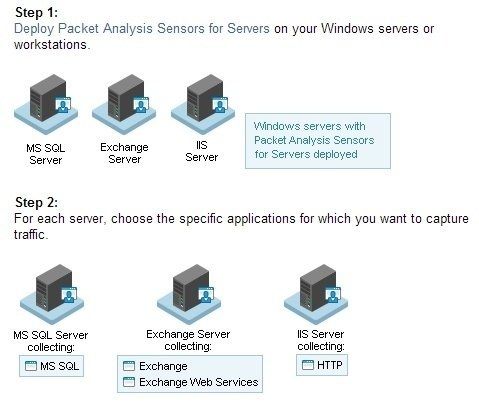
For monitoring Windows servers with DPI you have to install Windows agent. You can install it directly from the console, or you can download the agent and set up mass deployment with your system of choice.
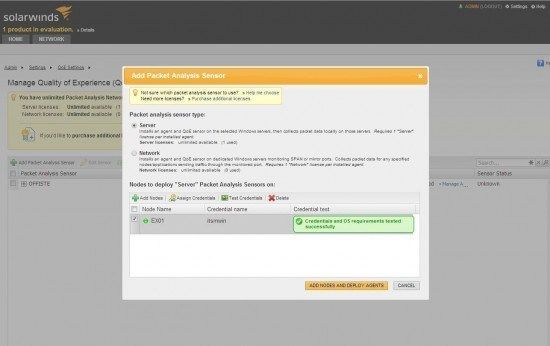
First you have to add nodes where you would like to use DPI.
Once nodes have been added, you have to select a service you would like to monitor.
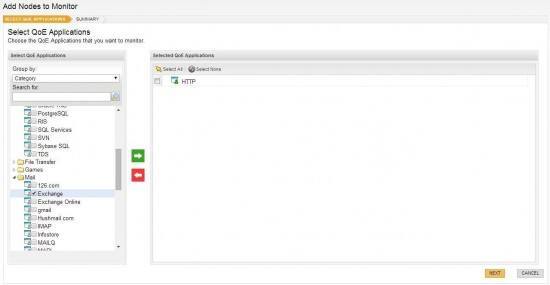
I was impressed by the amount of services NPM 11 supports. You can find most databases such as Oracle, MS SQL, MySQL, and Postgress. In addition, NPM11 supports Exchange and Exchange Online to web services like Dropbox and Skype.
You can pinpoint the service that is using the most bandwidth easily. What’s more, you can immediately see which services are working normally or services that will soon affect user experience and then act accordingly.
Once the agent starts collecting data, you can dive deep. The information provided is really extensive and you can easily spot the problems. For example I Installed the agent on exchange server. I could see transactions, services, response time, and volume.
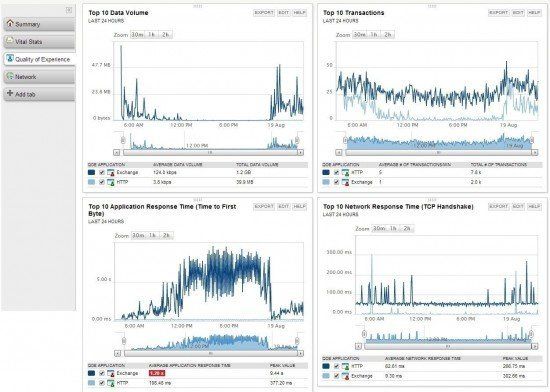
But what makes QoE so great is that you can create your own dashboard where you tie complete network equipment and servers together. You get a complete picture of your environment. You can see how your network behaves and how servers and storage are utilized…this feature really shines. Download 30 days FREE Trial of SolarWinds NPM11
Network Mapping
What’s better than to visualize your own environment with customized maps? Your own rack on collocation, your server room, assets in multiple countries or assets in one city with many locations. You can build you own map, the way you want.
SolarWinds NPM has built-in Network Atlas which provides visual device mapping. You can create your maps from map templates which are provided by SolarWinds. There are many to choose from such as flooring, world maps, country maps, or you can upload your own. You can also integrate Openstreet maps to your map.
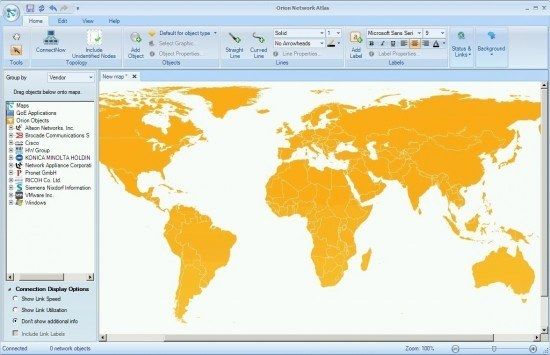
All you have to do is to place devices on a map, SolarWinds NPM will take care of connections between them.
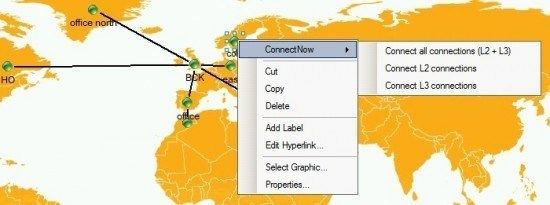
If you used to spend a lot of time manually creating topology maps, SolarWinds will save you a lot of time.
Mobile View
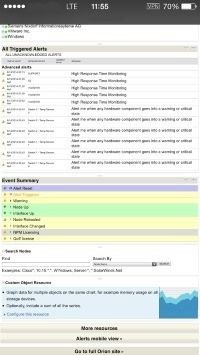
SolarWinds NPM has support for mobile devices. If you use a tablet or a mobile phone, you can log in to your NPM and review your current network activity. NPM web console is responsive meaning that it adjusts the view based on the device. You don’t have to install a mobile application to access NPM on your mobile device.
Cisco EnergyWyse Monitoring
If you have Cisco devices that give you information about power consumption, wouldn’t you like to see how much they consume? SolarWinds can monitor Cisco EnergyWyse enabled devices like IP Phones, Access points and IP Enabled building controllers. You can really put this information to good use. Moreover, it can be useful for budget as well.
Intelligent Alerting
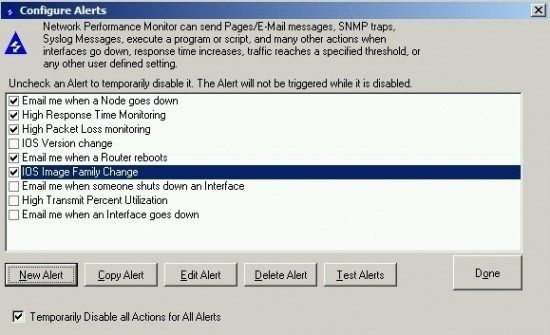
With SolarWinds NPM 11 alerting can be tailored to the most complex requirements. Imagine if you were alerted before a problem starts, users won’t even not notice. You can alert different people on different times in different ways like email, pager, external application or syslog.
Reporting
Reporting is another strong aspect of SolarWinds NPM 11, it has 128 reports built-in. If you can’t find the report you need, you can create your own. Reports can be ran manually or scheduled. If scheduled, reports can be sent to mail, printed or saved on a specific date.
Pricing
| SolarWinds Network Performance Monitor SL100 (up to 100 elements) – License with 1st-year Maintenance | $2,675 |
| SolarWinds Network Performance Monitor SL250 (up to 250 elements) – License with 1st-year Maintenance | $5,875 |
| SolarWinds Network Performance Monitor SL500 (up to 500 elements) – License with 1st-year Maintenance | $8,975 |
| SolarWinds Network Performance Monitor SL2000 (up to 2000 elements) – License with 1st-year Maintenance | $15,675 |
| SolarWinds Network Performance Monitor SLX (unlimited elements-Standard Polling Throughput) – License with 1st-year Maintenance | $25,775 |
Download SolarWinds NPM11 trial
SolarWinds Network Performance Monitor 11 Review Conclusion
SolarWinds Network Performance Monitor is an enterprise grade monitoring solution which has improved an already solid product. It can grow with you as your business grows. SolarWinds Network Performance Monitor scales from 50 to 100,000 elements easily. Some say it’s expensive, even though there are tools that exceed SolarWinds price. Something is true, SolarWinds NPM is not the cheapest tool, but it’s also not the most expensive. In this case you get what you pay for, a top notch product with great support. You can also visit SolarWinds Thwack community forum where users exchange their experiences. You can find more information on SolarWinds NPM product page. Give NPM11 a try, you may surprise you.


Leave a Reply